2. Limited Private Sector Involvement
Despite the significant financial outlay, Iran's private sector saw minimal returns from its Syrian engagement. Between 2011 and 2018, an average of five Iran-linked companies registered in Syria annually. This number surged to 51 between 2019 and 2021, coinciding with perceived stabilization in Syria, but declined to 11 between 2022 and 2023. Factors contributing to this decline include ongoing Western sanctions, economic instability, and a fragmented security landscape.
3. Trade Dynamics
Trade between Iran and Syria remained limited throughout the conflict. From 2011 to 2022, Iran ranked as Syria’s 19th export market and 12th source of imports, excluding discounted crude oil exports provided on credit. Iranian officials and businessmen frequently expressed dissatisfaction with their modest share of commerce relative to other nations, despite strong political ties.
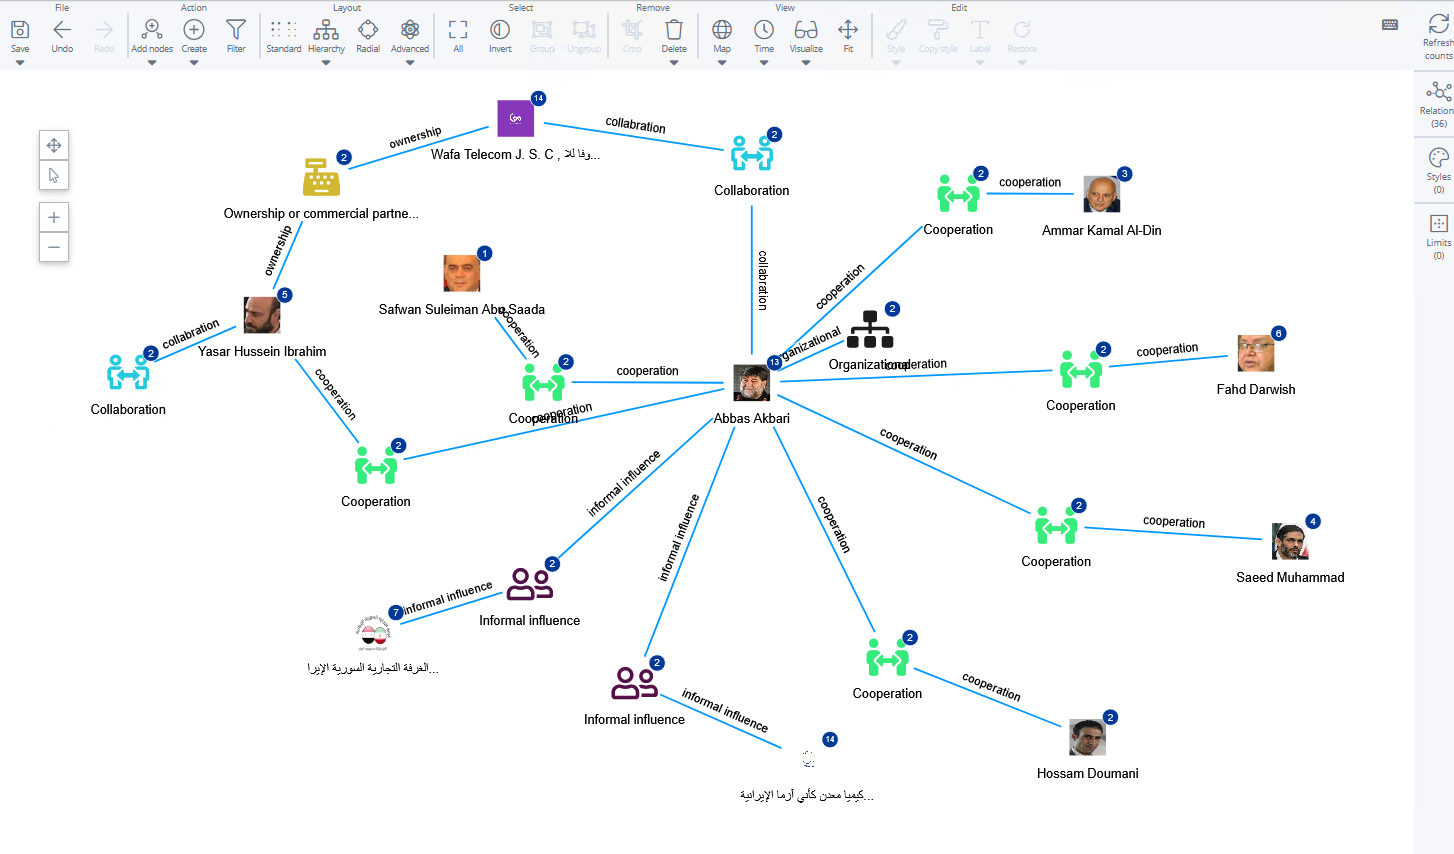
Interactive Network Graph: Visualizing Iran's Economic Footprint
A pivotal component of this analysis is an interactive network graph developed. This tool offers a visual representation of Iran's economic involvement in Syria from 2011 to 2023, mapping relationships between Iranian entities and Syrian counterparts across various sectors.
Features of the Interactive Graph:
- Entity Mapping: Illustrates connections between Iranian state-owned enterprises, private companies, and Syrian organizations.
- Sectoral Analysis: Highlights investments across key sectors, including telecommunications, energy, construction, and manufacturing.
- Temporal Dynamics: Allows users to explore how Iran's economic engagements evolved over time, reflecting shifts in strategy and focus.
- Geospatial Context: Integrates geographic data to show the regional distribution of investments and partnerships within Syria.
Accessing the Graph:
The interactive network graph is publicly accessible and serves as a valuable resource for researchers, policymakers, and stakeholders interested in understanding the complexities of Iran's economic activities in Syria. Users can explore the graph to gain insights into the depth and breadth of these engagements.
Conclusion
Iran's economic involvement in Syria between 2011 and 2024 reflects a strategic endeavor to maintain and expand its influence in the region. While the financial commitment was substantial, tangible returns, particularly for the private sector, were limited. The interactive network graph stands as a testament to the intricate web of relationships forged during this period, offering a comprehensive visualization of Iran's economic footprint in Syria.